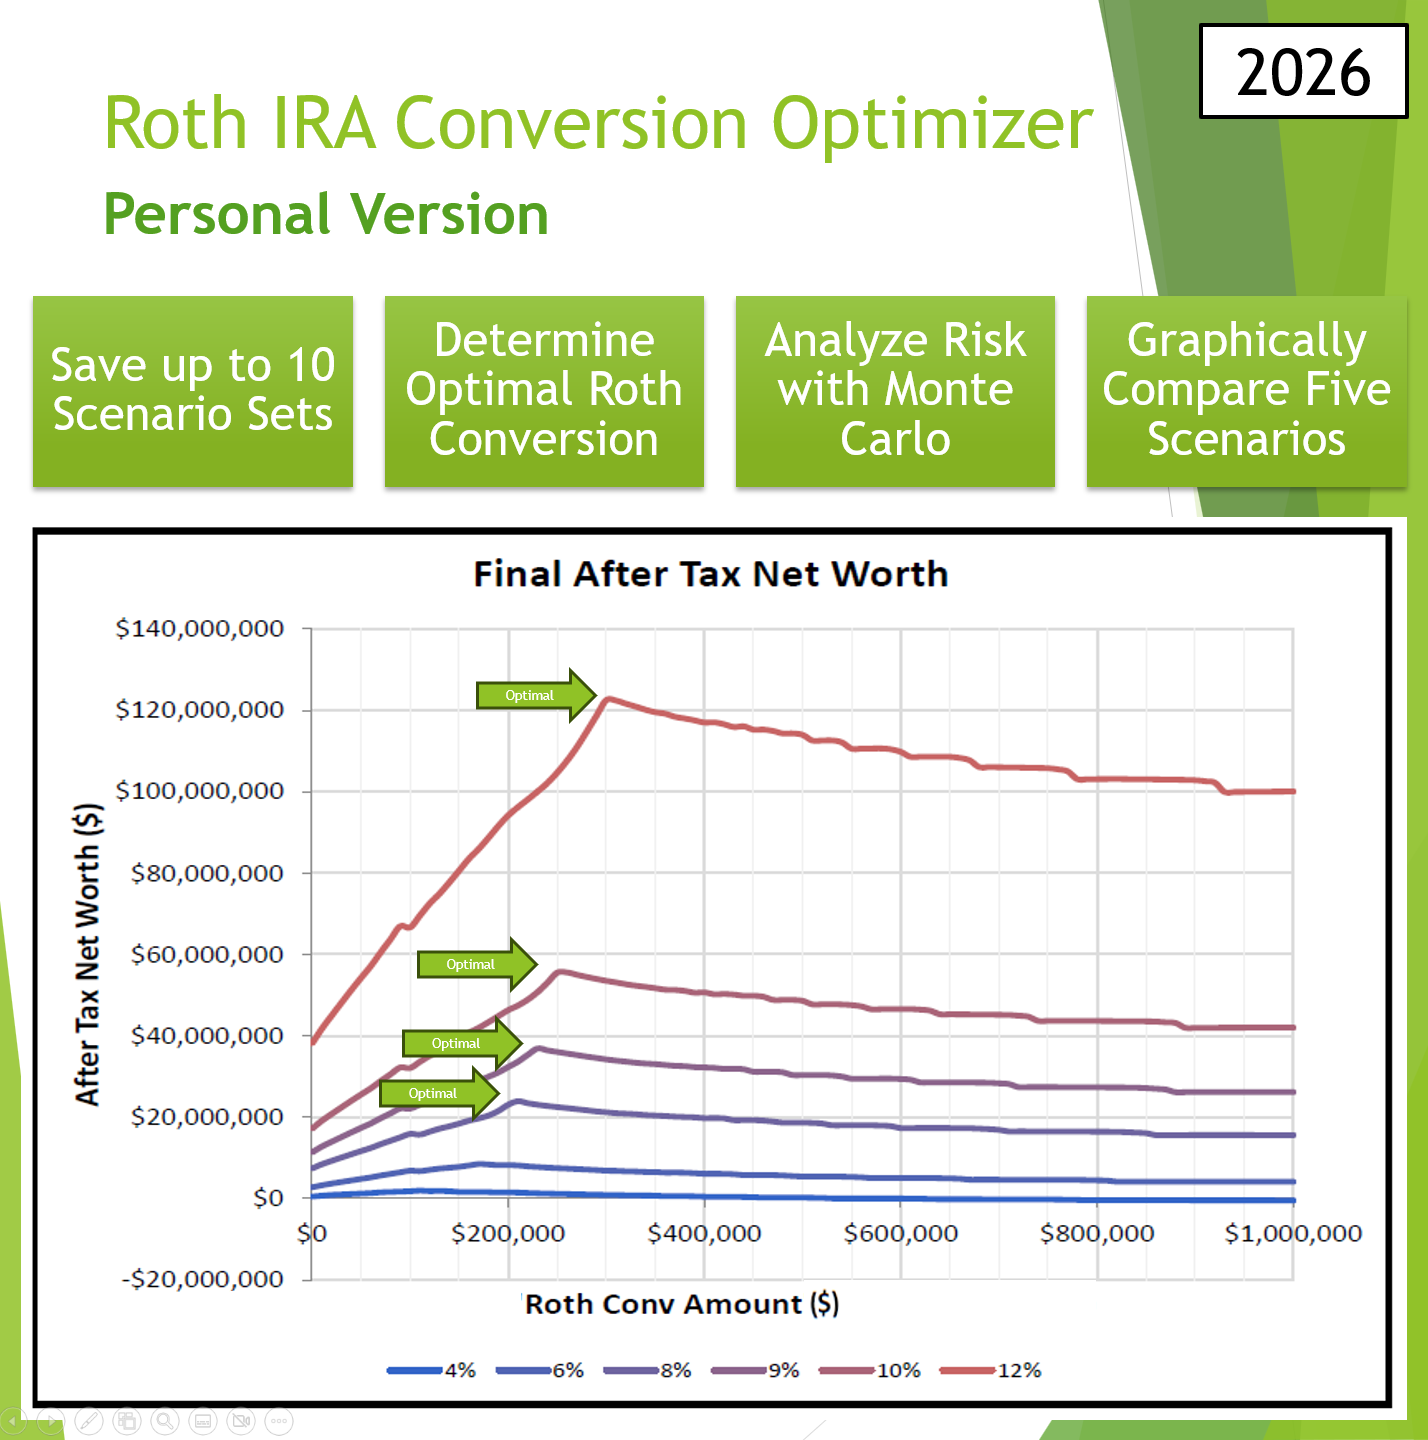
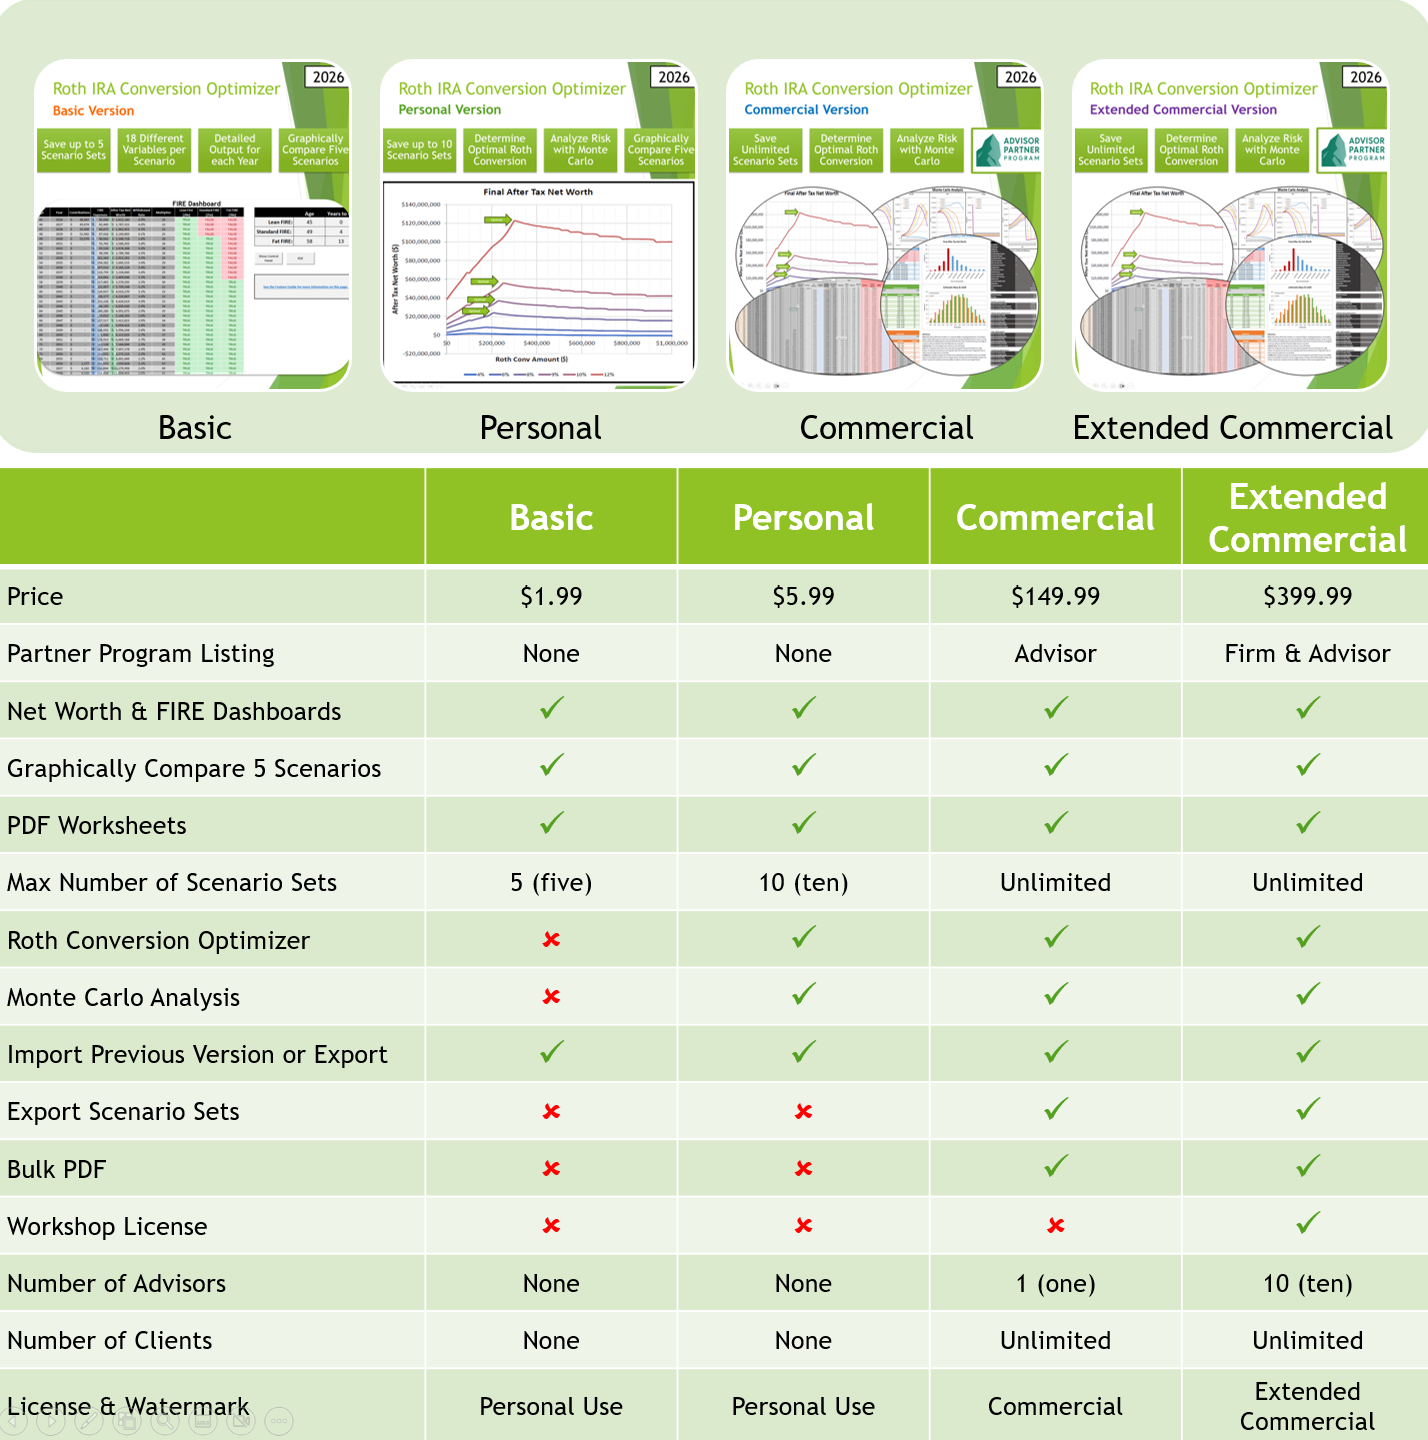
View optimal Roth conversion amount in a single chart. Run a Monte Carlo analysis. Compare five different retirement scenarios. Save up to 10 Scenario Sets (60 Scenarios). The latest version of Excel for Windows or Excel for Mac (Microsoft 365) is required.


Examples:
- What is the optimal Roth conversion amount?
- What’s the impact of RMDs and IRMAA?
- What’s the market risk in my plan? Do I have enough to retire?
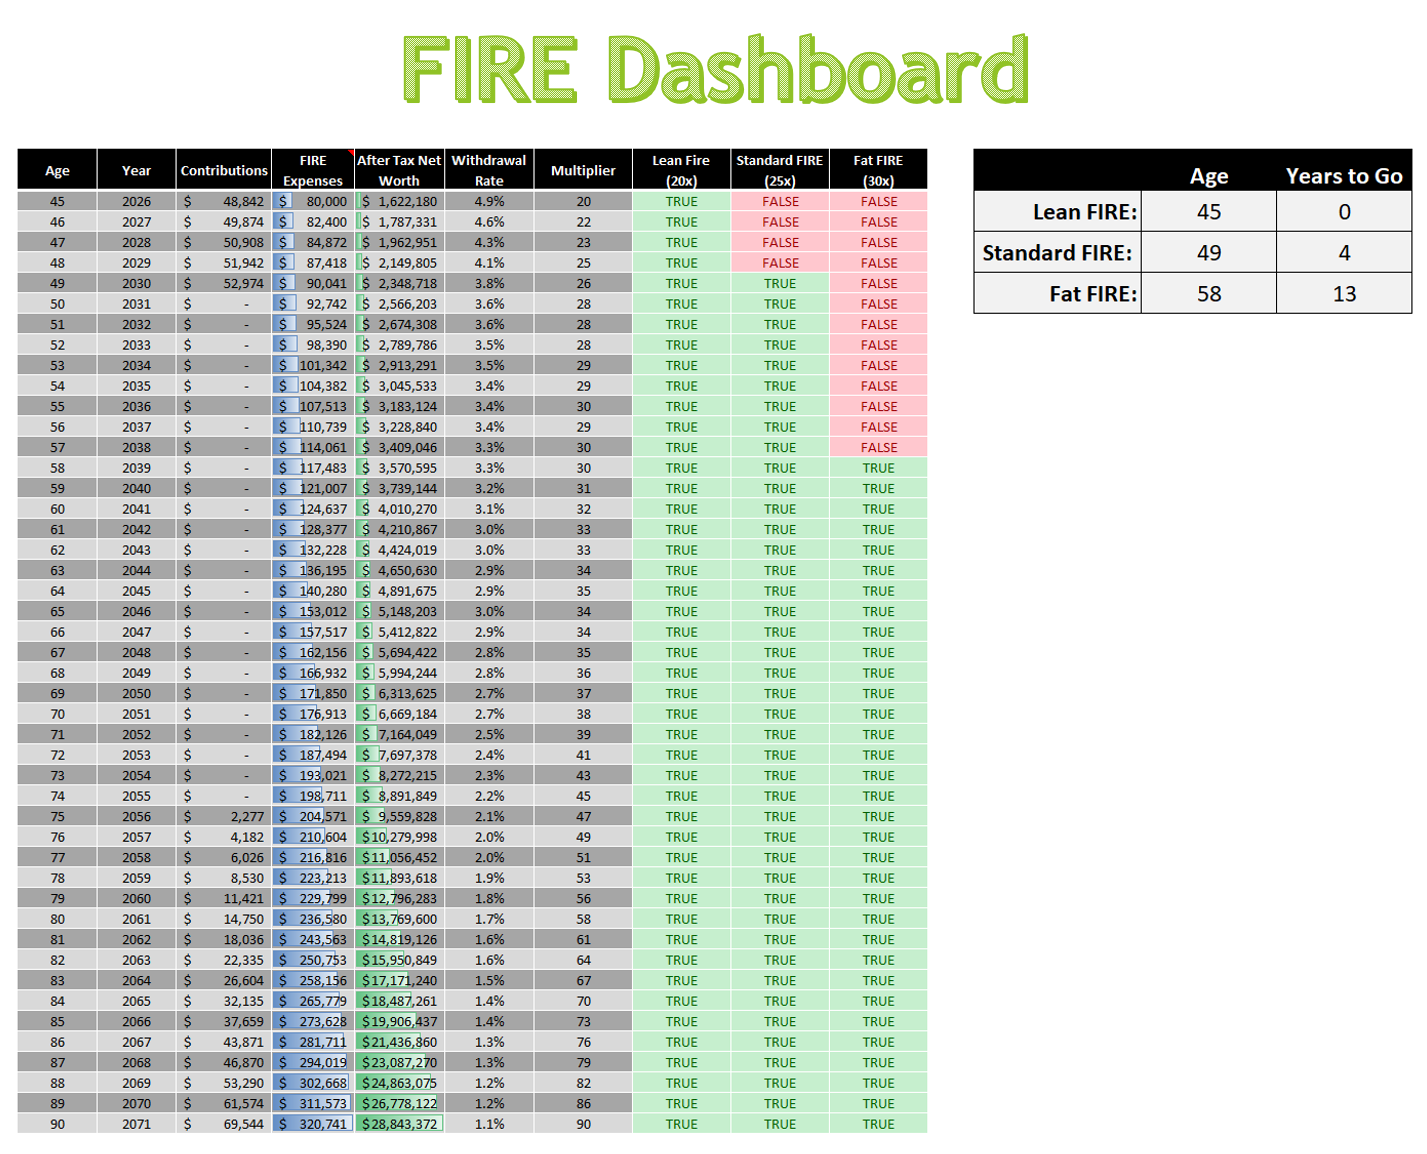
- How soon until I can FIRE (Financial Independence Retire Early)?
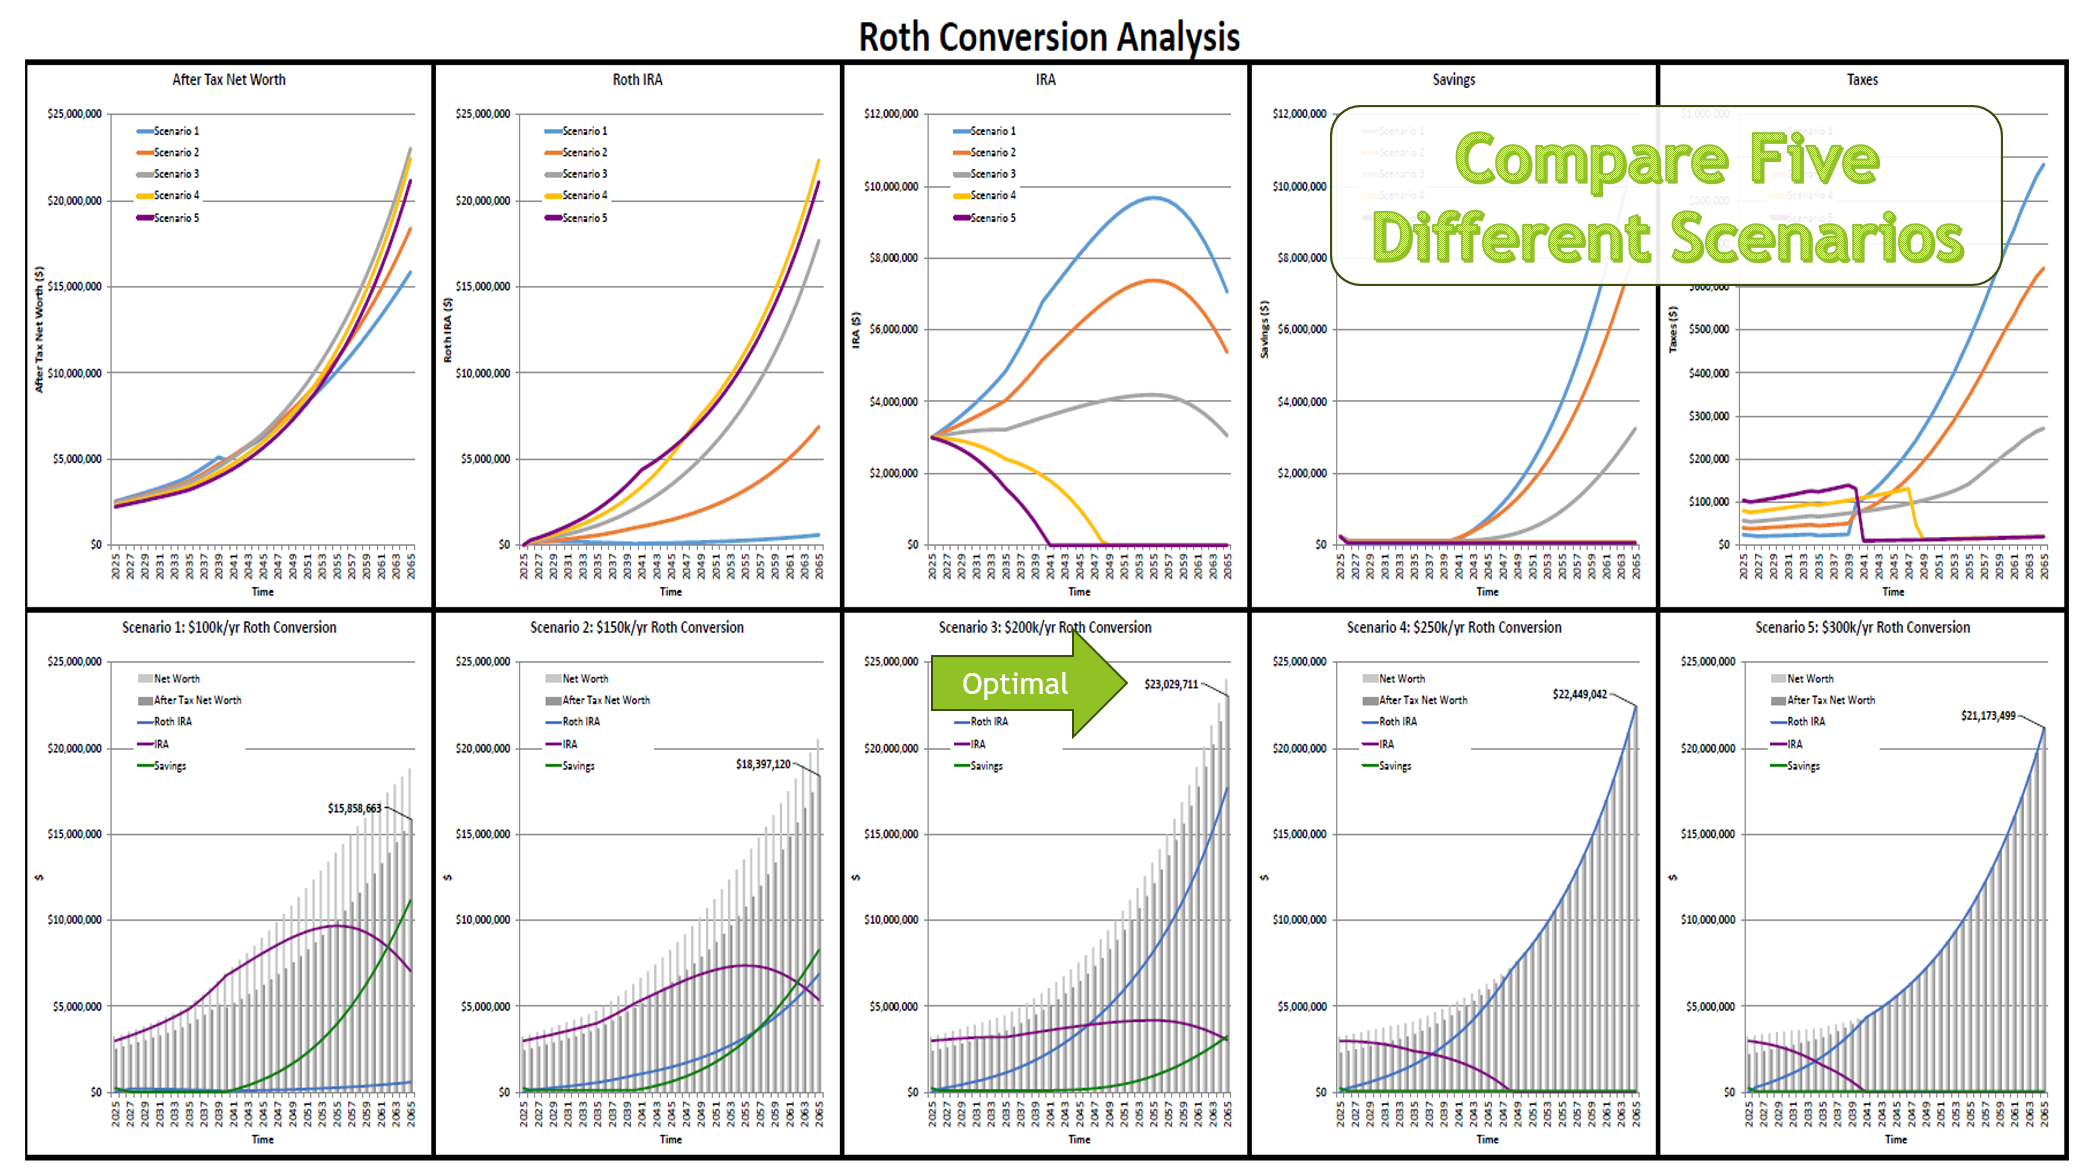
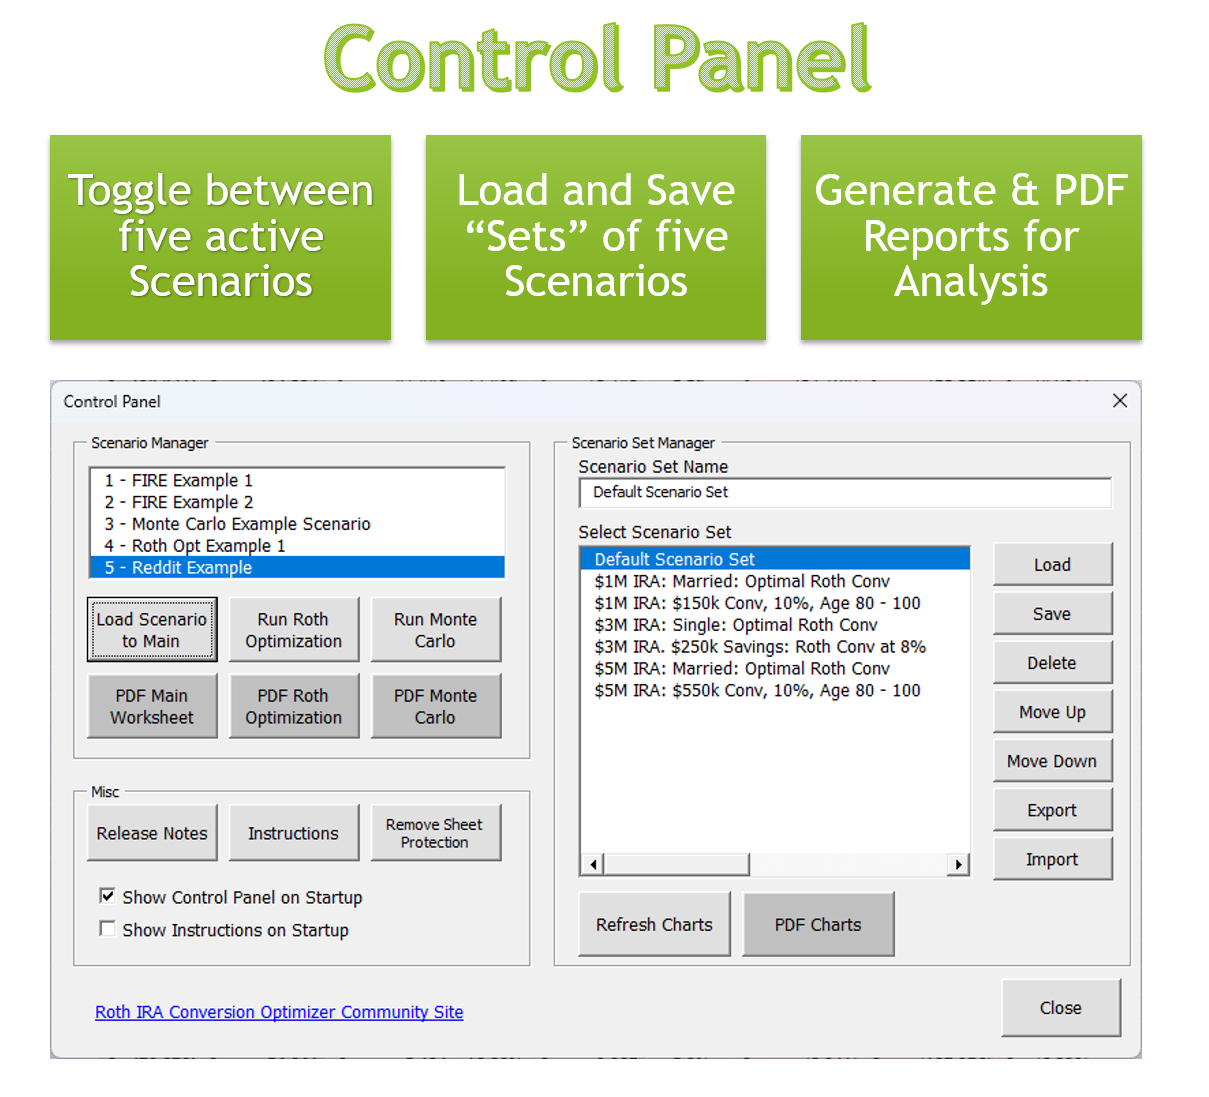
Most of the retirement calculators on the market today show you one scenario and sometimes they compare it to a baseline. If you want to test different scenarios, you have to change all your inputs and re-run the calculator. This Excel application it different. It allows you to create a “Set” of five different scenarios and compare them graphically to determine which scenario performs best. Furthermore, each Set of five scenarios can be saved and there’s no limit to the number of Sets you can save. The endless cycles of re-entering data to test different inputs is eliminated! All your Scenario Set Charts can be exported to PDF for analysis in a PDF reader or on paper.
While this spreadsheet can analyze a large number of retirement scenarios, where it really shines is for Roth IRA conversion analysis. There is a dedicated chart that shows you the optimal Roth Conversion levels for your specific scenario. Once you’ve found your optimal scenario, you can then run a Monte Carlo analysis of it to determine your market risk!
Available at excelappshop.etsy.com