
Table of Contents
Getting Started & Core Resources
Note: Verified buyers are entitled to free updates until the next year’s version is released with updated tax brackets. This transition will occur in Q1. Message the Etsy shop owner for a link to download the latest version.
QUICK START GUIDE
Check out the Quick Start Guide to get started.
CASE STUDY EXAMPLE
See the HNW Client case study for an example of how to set up a Scenario Set. This example is included with the Optimizer v4.5a and beyond. It is the Scenario Set called “Bracket Fill to Age 90 Example”.
COMPLIANCE DISCLOSURE DOCUMENT
For firms requiring FINRA Rule 2214 compliance, a Compliance Disclosure Document has been created to assist with the compliance process. This is also an excellent document for users to get a detailed overview of the criteria, methodology, calculation logic, assumptions and limitations of the tool.
BACKGROUND INFO
In order to optimize results, the spreadsheet will maintain a consistent tax rate across each year starting with the Roth Conv Start Year until forced otherwise (by RMDs, etc.). To do this, it adjusts the Roth IRA conversion amount until the non-LTCG income matches the amount entered by the user in the Income Target field. To ensure optimal amounts, the IRA Withdrawal and Roth conversion amounts are both calculated automatically and displayed in the “Roth Conv” and “IRA Withdrawal” columns on the Main worksheet.
Control Panel
The Control Panel can be displayed on any page by pressing the “Show Control Panel” button on that page.
See the Tabbed Control Panel Blog Post for more details on the tabbed Control Panel that was added in version 4.2.


TOOL TIPS
All the controls in the Control Panel have tool tips. Hover over a button or list box for a short explanation of what that control does. The Control Panel must be selected for the tool tips to appear.

CREATING AND LOADING YOUR FIRST SCENARIO
Create your first Scenario by editing the values in the active scenario set on the Scenario Set worksheet (columns C to G). Next, if applicable, modify the light blue columns in the Main worksheet to represent any additional income or one-time expenses. To see your values reflected in the table on the Main worksheet, select one of the five Scenarios and click the Load Scenario button. This will make the selected scenario the active scenario and populate the Main worksheet with the active scenario data.


FINDING THE OPTIMAL ROTH CONVERSION (disabled in Basic version) To find the optimal roth conversion for the active scenario, click the Run Roth Optimization button. This will test every Income Target value from 0 to $1M at $10k intervals for the six interest rates shown in the column headers on the Roth Conversion Optimizer worksheet for the selected Scenario. It will display the results in both a table and chart. The column headers can be modified if different rates of return are desired. The table assumes all the returns (Savings, IRA, & Roth IRA) are the same. Once the optimal Income Target value is identified, the user can enter and load that value back in the active scenario and view it in the Main worksheet.

See the Roth IRA Conversion Optimization Feature Guide for more information.
MONTE CARLO ANALYSIS (disabled in Basic and Commercial versions)
To run a Monte Carlo simulation, click the Run Monte Carlo button. This will randomize each year’s returns around the value entered for the IRA Retirement Return in the active scenario. The default number of simulations is 500. The default standard deviation is 15%. Both of these can be changed if desired in cells J8 and J9 on the Scenario Sets worksheet. A histogram showing the Monte Carlo results will be generated on the Monte Carlo worksheet.
See the Monte Carlo Simulation Feature Guide for more information.
CREATING YOUR FIRST SCENARIO SET
Create your first scenario set (Scenarios 1 – 5) by editing the top table on the Scenario Sets worksheet.
SAVING SCENARIO SETS
To save a scenario set, enter a name for the scenario in the textbox in the Scenario Set Manager and click the Save button. This will save a copy of the active scenario set on the Scenario Sets worksheet to the bottom of the list of tables on the same worksheet. If a copy already exists with the same name, it will overwrite that copy instead of making a new one.
LOADING A SAVED SCENARIO SET
To load a specific scenario set, select the desired item in the list box and then click the Load button. The Load button will copy the appropriate scenario set to the table on the top of the Scenario Sets worksheet, making it the active scenario set.
REFRESH CHARTS WORKSHEET
After loading a scenario set, you need to click the Refresh Charts button to see the new scenario set displayed on the Charts worksheet. The active scenario set does not have to be saved in order to refresh the charts.
DELETING SCENARIO SETS
To delete a scenario set, select it in the list box and click the Delete button. This will delete the selected scenario set.
IMPORTING AND EXPORTING
The Export button will save all your scenario sets to a separate Excel file. The Windows version will allow the user to select the export location. The Mac version will automatically save it to the Desktop. The Import button will load all the scenario sets from a previously exported file or previous version of the spreadsheet (v3.3a and later). Importing will overwrite any saved scenarios sets currently in the sheet. The primary purpose of these buttons are to allow you to move your scenario sets to a new version of the file.
See the Effortless Upgrades post for more information.
PDF BUTTONS
These buttons allow you to quickly save the corresponding worksheets to a PDF file. The Windows version will allow the user to select the pdf location. The Mac version will automatically save it to the Desktop.
REMOVE SHEET PROTECTION (disabled in Basic version)
This button will allow you to temporarily remove the sheet protection. With sheet protection removed, you can customize the sheet if desired and better analyze the formulas. Note: Using this button to make customizations is for advanced users only. There is no support for customized workbooks.
Settings Worksheet
The blue colored cells on the “Settings” worksheet can be modified. While the default settings on this worksheet will be sufficient for most users, if a higher level of accuracy is desired, this worksheet provides additional functionality.
All the settings on the Settings worksheet are applied globally. Any changes will apply to all Scenarios and Scenario Sets.

Settings
ADDITIONAL SETTINGS
- Show Control Panel on Startup: Check this box if you want the Control Panel to display when you open the file.
- Show Help Icons on Startup: Set this to “No” if you want to hide the help icons. This can also be changed from the Control Panel. See the help icons post for more information.
- Fixed Income Percentage: This is where you set the percentage of your non-Retirement Savings that you want to be in Fixed Income. See the LTCG Post for more information.
- Fixed Income Return: This is where you set the rate of return for your Fixed Income. See the LTCG Post for more information.
- Dividend Return: This is the percentage of the the equities in your savings account that you expect to get as a dividend. This amount will be added to the Fixed Income column and taxed as normal income.
MONTE CARLO SETTINGS (Personal version only)
Note: The Monte Carlo settings are not visible on the commercial versions.
- Monte Carlo Simulation: The spreadsheet will automatically set this to “Yes” for a Monte Carlo simulation and then set it back to “No” when it’s done. If a user wants to see what random returns looks like on a single iteration, they can enable this manually and view the results on the Main worksheet.
- Monte Carlo Standard Deviation: The standard deviation is the dial that sets how much uncertainty your Monte Carlo simulation injects into the model. The default is 15% which is aligned with the S&P 500. The user can increase this value for more volatility and decrease it for less.
- Monte Carlo Sim Iterations: This is how many iterations the Monte Carlo function will run with each iteration providing a new set of random results. It allows anywhere from 10 to 10,000 iterations. The default is set to 1000. Increasing the iterations will increase the time it takes to generate the report. For example: it could take 30 minutes to run with 10000 iterations.
- Monte Carlo Return Target: This allows you to choose the return targeted by the Monte Carlo simulation. It defaults to “Estimated CAGR” which will result in a median CAGR close to your rate of return (RoR) input setting. Alternatively, if you want the median arithmetic mean, instead of CAGR, to match your RoR input setting, then you can switch this to “Arithmetic Mean”. In both cases, you will see a similar volatility drag.
MFJ SETTINGS
See the MFJ Section of Hidden Worksheets Blog Post for additional instructions on the MFJ Settings section.
- Spouse IRA Amount: Enter your total balance across your spouse’s IRA and 401(k) accounts.
- Spouse Social Security Benefit: This is the amount you expect to get in your first year collecting Social Security
- Spouse Social Security Start Age: This is the year you expect your spouse’s Social Security payments to start. If you have already started Social Security, you should enter your spouse’s current age here.
- Spouse Current Age: This should be your spouse’s current age.
MISCELLANEOUS SETTINGS
- Last Year’s Taxes: Enter last year’s taxes here. (The year before the current year.) This will be added to the current year’s expenses. If this is set to zero, last year’s taxes will be estimated. Note, setting a value here is strongly recommended. It will be more accurate and will provide better results since the value will be stable for the Optimizer function.
- RCO Income Target Increment: This is the size of the income target increment on the Roth Conversion Optimizer table. The default is set to 10,000 which will take the income target up to $1.0M. 101 rows will be created with whatever increment is used. As an example, an increment of 1,500 will create a table from 0 to $150,000. An increment of 15,000 will create a table from 0 to $1.5M.
- Enable Social Security Lookup Table: When enabled, the Social Security Benefit from the Scenario Set will be ignored and the amount will be calculated from the lookup table for both Self and Spouse.
- Savings Threshold: This determines how aggressively the application will drain the Savings before switching to the IRA/Roth. A value of 0 will drain until empty. A value fo 2 will leave some money in savings.
- Roth End Year: This will set a “stop year” for the Roth conversions. The default is year 2200, which is equivalent to not having a stop year.
- Control Panel Top/Left: Enter 0 for both Top and Left to reset Control Panel location.
- PDF Directory: If a value is added here, PDFs will automatically go to this location. Otherwise, it will default to the Desktop.
- Import/Export Directory: If a value is here, the import/export file dialog will default to this location. Otherwise, it will default to the same directory as this spreadsheet.
- Disable Tax Bracket Refresh: Use this if you want to overwrite the existing tax brackets (test alternate scenarios, fix bracket errors, etc.)
- Disable Warnings: Setting this to yes will disable the warning on the “Remove Sheet Protection” button.
- RMD Start Year: Use this to change the start year for RMDs.
- Minimum Tax Rate for ATNW: Use this to force the ATNW down in years where there is low tax.
Commercial-Only Settings
ESTATE TAX SETTINGS
- Enable Estate Tax: When enabled, the net worth in the last year of the projection has federal estate tax, state estate tax, and heir income tax applied to it to determine the after-tax net worth. When disabled, the after-tax net worth in the last year is calculated based on the effective tax rate for that year (same as all the other years).
- Enable IRD Deduction: When enabled, the IRD deduction is calcualted and Inherited IRA is reduced by this amount before applying the heir income tax.
- Federal Exemption ($): This is the exemption amount for Federal estate tax. This is adjusted for inflation (tax bracket inflation rate).
- Federal Estate Tax Rate: Federal estate tax will be taken at this rate once the estate value exceeds the inflation adjusted Federal Exemption value.
- State Exemption ($): This is the exemption amount for State estate tax. This is adjusted for inflation (tax bracket inflation rate).
- State Estate Tax Rate: State estate tax will be taken at this rate once the estate value exceeds the inflation adjusted State Exemption value.
- Heir Income Tax Rate: This is the rate you expect the inherited IRA to be taxed at by your heirs.
OTHER SETTINGS (Commercial-only starting 2027)
- Enable Time Horizon Sensitivity: When enabled, the lower optimization table will be filled out on the Roth Conversion Optimizer worksheet. This table calculates the optimal conversion across different time intervals instead of rates of return. Note: When enabled, the optimization function will take roughly three times longer to run.
- IRA After-tax Basis ($): If you have after-tax contributions in your IRA, enter the after-tax basis here. Unhide the “IRA Basis” worksheet to see the pro-rata calculations.
- Widow Tax Year: Enter the year you want the filing status to switch to “Single”.
- Social Security Reduction Year: This is the year that the Social Security reduction in the cell below takes effect. The default is 2100 which effectively disables it.
- Social Security Reduction Percentage: This is the percent Social Security reduction that goes into effect the year listed above.
Scenario Sets Worksheet
The Scenario Set worksheet is where the user can see the Active Scenario and edit the five Scenarios of the Active Scenario Set. The “Main” column is the Active Scenario set. This column can not be edited manually. To update the Active Scenario set, you must load one of the five Scenarios listed in the columns on the right. The five Scenarios on the right are all editable.
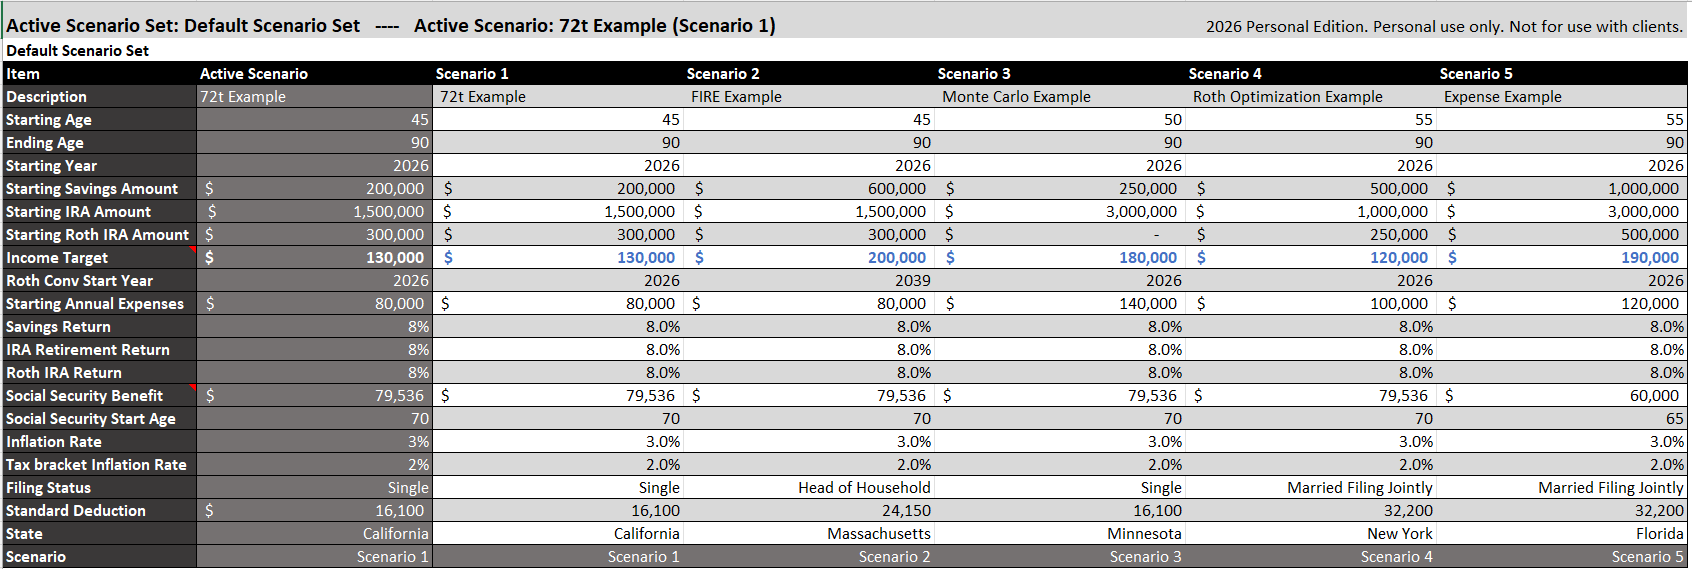
- Description: Type the name or description of this scenario.
- Current Age: This should be your current age
- Ending Age: This is how far you want the model to go—typically this is how long you expect to live.
- Current Year: Put the current year (2026). The tool will allow you to enter other years, but this is for specific legacy and commercial purposes. This is not a supported mode because the year will not match the tax brackets (state, fed, NIIT, LTCG, IRMAA, Social Security, and NIIT). The tool will display a warning when loading the Scenario if the years don’t match. Please purchase a new version each year to avoid this issue.
- Current Savings Amount: This is the value of all your non-retirement financial assets. Typically, this is a combination of savings accounts and brokerage accounts. If you’re filing status is Married Filing Jointly, combine you and your spouse’s assets here.
- Current IRA Amount: Enter your total balance across your IRA or 401(k) accounts. If you file Married Filing Jointly, you have two options:
- Option 1 (Recommended): Combine your and your spouse’s assets into this single field. This approach is sufficient for most users.
- Option 2: Enter only your assets here, and enter your spouse’s assets on the Settings worksheet. Use this method for greater precision, especially if there is a significant age difference between you and your spouse.
- Current Roth IRA Amount: This is how much you have in your Roth IRA or Roth 401k. If you’re filing status is Married Filing Jointly, combine you and your spouse’s assets here.
- Income Target: This sets the desired income target (inflation adjusted). For the first pass, set it to $0. This will tell the Optimizer to use a special “Baseline Mode” which will disable Roth IRA conversions. For subsequent passes and Scenarios, use the Roth Conversion Optimizer function to determine the optimal values for you. It’s recommended to use a value of $0 for Scenario 1 and other values in Scenarios 2 – 5 so you can see the impact of the Roth conversions relative to the baseline.
See the Roth Conversion Optimizer Feature Guide for a detailed explanation of the optimization function.
See below for the full list of special modes (v4.5a and beyond).- $0 – Baseline Mode (no Roth Conversions)
- $1 – Fill the 10% bracket
- $2 – Fill the 12% bracket
- $3 – Fill the 22% bracket
- $4 – Fill the 24% bracket
- $5 – Fill the 32% bracket
- $6 – Fill the 35% bracket
- See the Roth Conversion Optimizer Feature Guide for a detailed explanation of the optimization function.
- Roth Conv Start Year: This is the year you want the Roth conversions to start.
- Current Annual Expenses: This is the amount of your living expenses.
- Savings Return: This is the amount of return you expect on your Savings (non-retirement income).
- IRA Retirement Return: This is the amount of return you expect on your IRA. It also sets the “Mean” for the Monte Carlo analysis.
- Roth IRA Return: This is the amount of return you expect on your Roth IRA.
- Social Security Benefit: This is the amount you expect to get in your first year collecting Social Security
- Social Security Start Age: This is the year you expect your Social Security payments to start. If you have already started Social Security, you should enter your current age here.
- Inflation Rate: This is the rate of inflation. Your expenses will increase by this amount each year.
- Tax Bracket Inflation Rate: This is the rate at which you expect the tax brackets (Federal, State, Social Security, LTCG, & Medicare/IRMAA) will increase each year.
- Filing Status: Select “Single”, “Head of Household” or “Married Filing Jointly”
- State: Select your state from the pulldown.
- Scenario: This field is not editable.
Main Worksheet
The Main Worksheet serves as your primary financial projection dashboard, displaying a detailed year-by-year breakdown of cash flows, account balances, tax calculations, and required distributions. As you select and load different scenarios, this worksheet automatically populates with updated data, allowing you to easily review your assets, income, taxes, expenses, Roth conversions, and long-term net worth trajectories.

Columns
- Age: Displays the primary user’s age for each projected year.
- Year: The calendar year corresponding to the financial projection row.
- Expense Source: Indicates which account or income stream is used to cover living expenses for that year.
- Roth IRA: The starting balance of the Roth IRA account at the beginning of the year.
- IRA: The starting balance of the traditional IRA / 401(k) account at the beginning of the year.
- Savings: The starting balance of non-retirement liquid savings and taxable brokerage accounts.
- Fixed Income: The portion of fixed income generated from the Savings account. The default percentage of Savings allocated to fixed income is set to 10% in the Settings worksheet.
- LTCG: The portion of long-term capital gains income generated from the Savings account. The default percentage of Savings allocated to LTCG income is set to 90% (the remainder of the Fixed Income percentage) in the Settings worksheet. See the link below for more information.
- RMD: Required Minimum Distribution amount calculated for the year based on IRS life expectancy tables.
- DAF / QCD (commercial versions only): Qualified Charitable Distributions made directly from the IRA or contributions to a Donor-Advised Fund. This field can be manually edited by the user. See the following links for more info.
- 72t (commercial versions only): Substantially Equal Periodic Payments (SEPP) taken under IRS Section 72(t) prior to age 59½. This can also be used for “Rule of 55” withdrawals. This field can be manually edited by the user. See the following links for more info.
- Social Security: Total combined Social Security benefits received during the year. This is inflation adjusted based on the value entered in the Scenario.
- Retirement Income: This value is automatically calculated by the spreadsheet. It is the value that must be withdrawn from the IRA to meet the inflation-adjusted income target specified by the user in the Scenario.
- Roth Conv and IRA Withdrawal: These values are automatically calculated by the spreadsheet. The portion of Retirement Income that must be used to pay expenses is an “IRA Withdrawal” the remainder, which is added to the Roth IRA balance is a Roth Conversion.
- Income: This is a user modifiable field that can be used to add any other sources of income such as w2 wages and pension. See the following link for more info.
- Standard Deduction: The inflation-adjusted applicable tax deduction entered by the user in the Scenario.
- Total Taxable Income: Gross income minus the standard deduction, used as the basis for calculating income taxes.
- Federal Tax: Total calculated federal income tax liability for the year.
- Federal Tax %: The effective federal tax rate (Federal Tax divided by Total Income).
- Marginal Fed %: The highest federal tax bracket that applies to the last dollar of taxable income.
- NIIT (commercial versions only): Net Investment Income Tax liability calculated on investment income above threshold amounts.
- State Tax: Estimated state income tax liability based on the selected state’s tax brackets.
- State Tax %: The effective state tax rate for the year.
- Total Tax: Sum of all federal, state, and NIIT taxes owed for the year.
- Annual Expenses: Inflation-adjusted regular living expenses for the year based on the value entered by the user in the Scenario.
- Medicare Premiums: Projected Medicare Part B and Part D premiums, including applicable IRMAA surcharges.
- One-Time Expense: User-editable field for any non-recurring expenses. See the following link for more information.
- Total Expenses: The combined total of annual living expenses, one-time expenses, and Medicare premiums.
- Net Cash Flow: Net surplus or deficit remaining after accounting for all income, expenses, and tax obligations.
- Roth Adj: Net adjustment made to the Roth to cover expenses. This does not include the amount from the Retirement Income column or the Roth IRA investment gains.
- Savings Adj: Net adjustment made to the savings account after covering expenses. This does include the investment returns on the savings account which are included in the Net Cash Flow column.
- After Tax Net Worth: Estimated net worth after deducting embedded tax liabilities on traditional IRA balances.
- Net Worth: Total combined value of all accounts (Roth IRA, IRA, and Savings) at year-end.
- Net Worth Increase: The nominal dollar change in total net worth compared to the previous year.
- Net Worth Increase %: The percentage change in total net worth compared to the previous year.
FIRE Worksheet
This worksheet is only accessible in the Basic and Personal versions of the Optimizer. The FIRE Worksheet provides an early-retirement planning dashboard designed to evaluate your progress toward financial independence using standard withdrawal rate benchmarks. By modeling your projected net worth and annual expenses over time, this sheet helps you track key milestones across Lean FIRE, Standard FIRE, and Fat FIRE thresholds—giving you clear visibility into how many years remain before achieving your desired level of financial independence.
See the FIRE Feature Guide for more information.

MFJ Detail Worksheet
This worksheet is hidden by default. Designed for Married Filing Jointly scenarios, this sheet isolates the IRA balances, RMD requirements, and Social Security projections for both individuals to ensure tax accuracy. This sheet is also where contributions to retirement accounts can be entered for all filing types.
See the Hidden Worksheets blog post for more information.
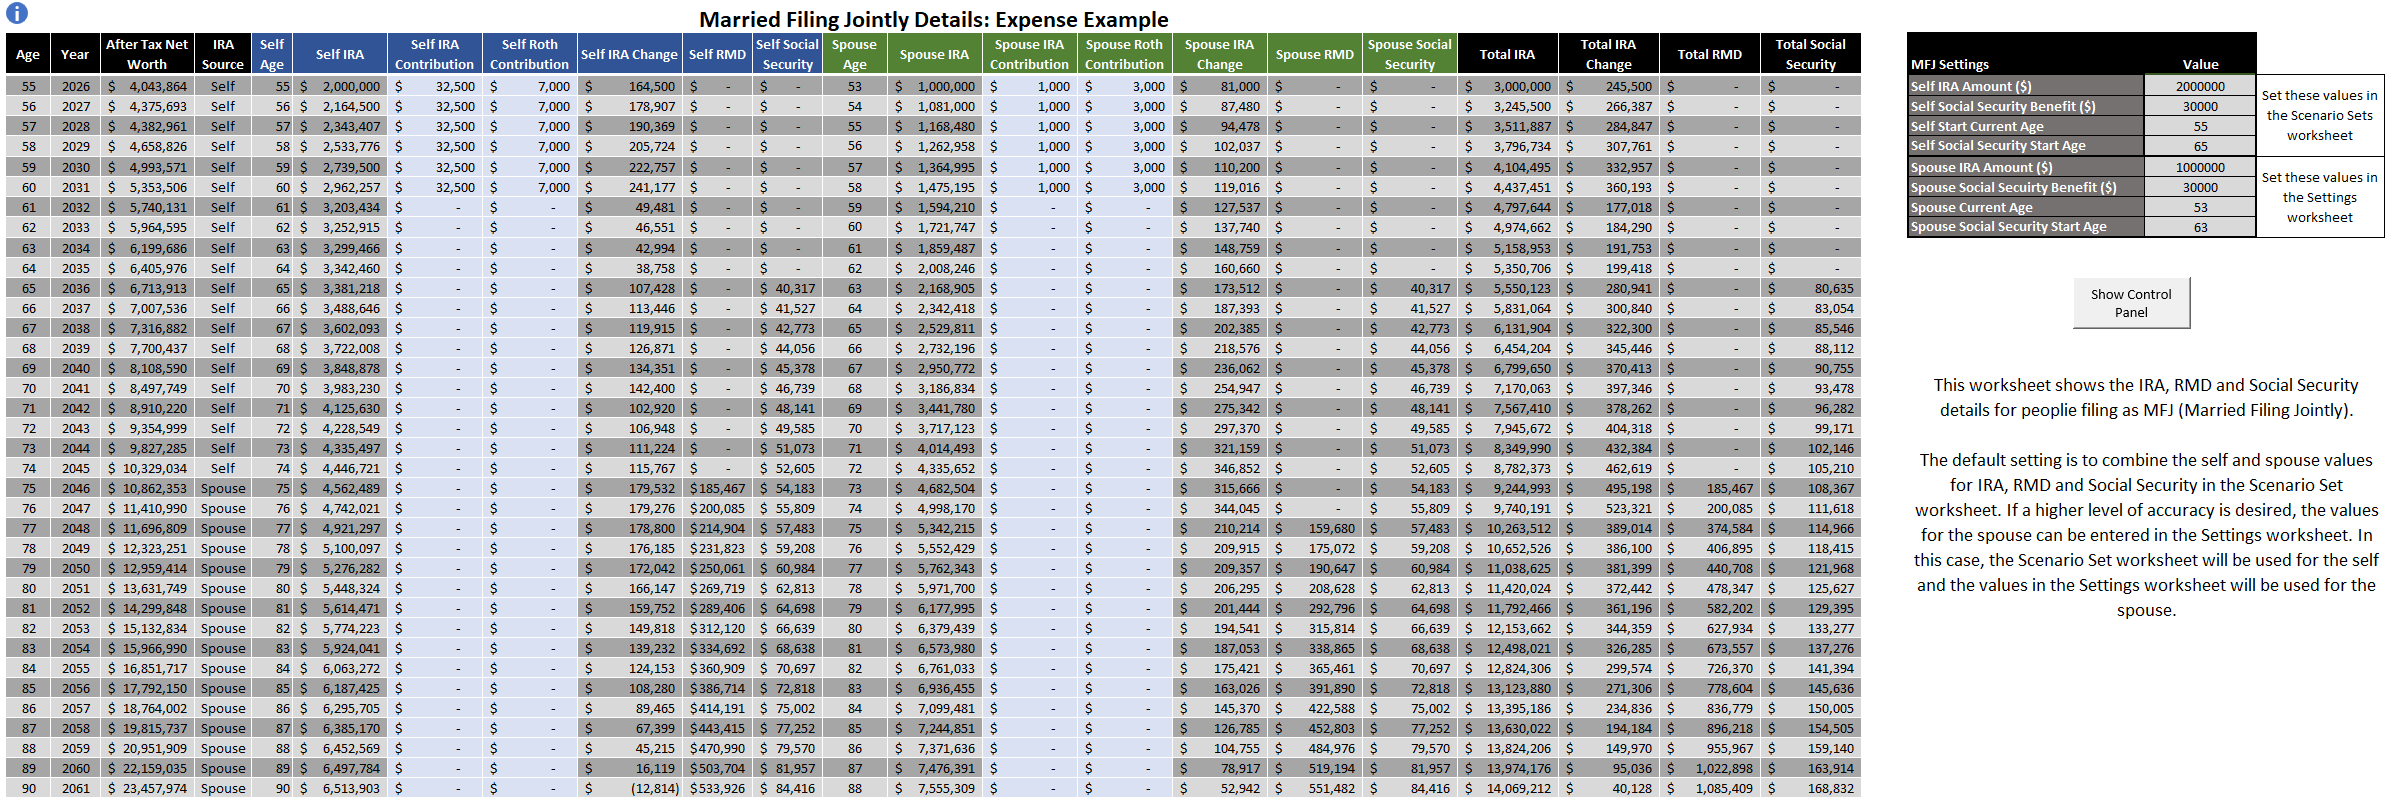
Columns
- Age: Displays the primary user’s projected age for each year.
- Year: The calendar year corresponding to the row’s financial projections.
- After Tax Net Worth: The estimated net worth after accounting for embedded tax liabilities on traditional IRA balances.
- IRA Source: Indicates which IRA account (Self or Spouse) is being drawn from or adjusted for that year.
- Self Age: The primary user’s age for the given calendar year.
- Self IRA: The starting balance of the primary user’s traditional IRA / 401(k) account.
- Self IRA Contribution: Annual contributions made to the primary user’s traditional IRA or 401(k) account.
- Self Roth Contribution: Annual contributions made to the primary user’s Roth IRA or Roth 401(k) account.
- Self IRA Change: The net change in the primary user’s traditional IRA balance for the year, reflecting withdrawals, contributions, and investment returns.
- Self RMD: The Required Minimum Distribution calculated for the primary user based on IRS life expectancy tables.
- Self Social Security: Inflation-adjusted Social Security benefits received by the primary user for the year.
- Spouse Age: The spouse’s age for the given calendar year.
- Spouse IRA: The starting balance of the spouse’s traditional IRA / 401(k) account.
- Spouse IRA Contribution: Annual contributions made to the spouse’s traditional IRA or 401(k) account.
- Spouse Roth Contribution: Annual contributions made to the spouse’s Roth IRA or Roth 401(k) account.
- Spouse IRA Change: The net change in the spouse’s traditional IRA balance for the year, accounting for withdrawals, contributions, and investment gains.
- Spouse RMD: The Required Minimum Distribution calculated for the spouse based on IRS life expectancy tables.
- Spouse Social Security: Inflation-adjusted Social Security benefits received by the spouse for the year.
- Total IRA: The combined starting balance of both the primary user’s and spouse’s traditional IRA / 401(k) accounts.
- Total IRA Change: The total combined annual net change across both spouses’ traditional IRA accounts.
- Total RMD: The combined Required Minimum Distribution amount required for both spouses for the year.
- Total Social Security: The total combined Social Security benefits received by both spouses for the year.
IRA Basis Worksheet
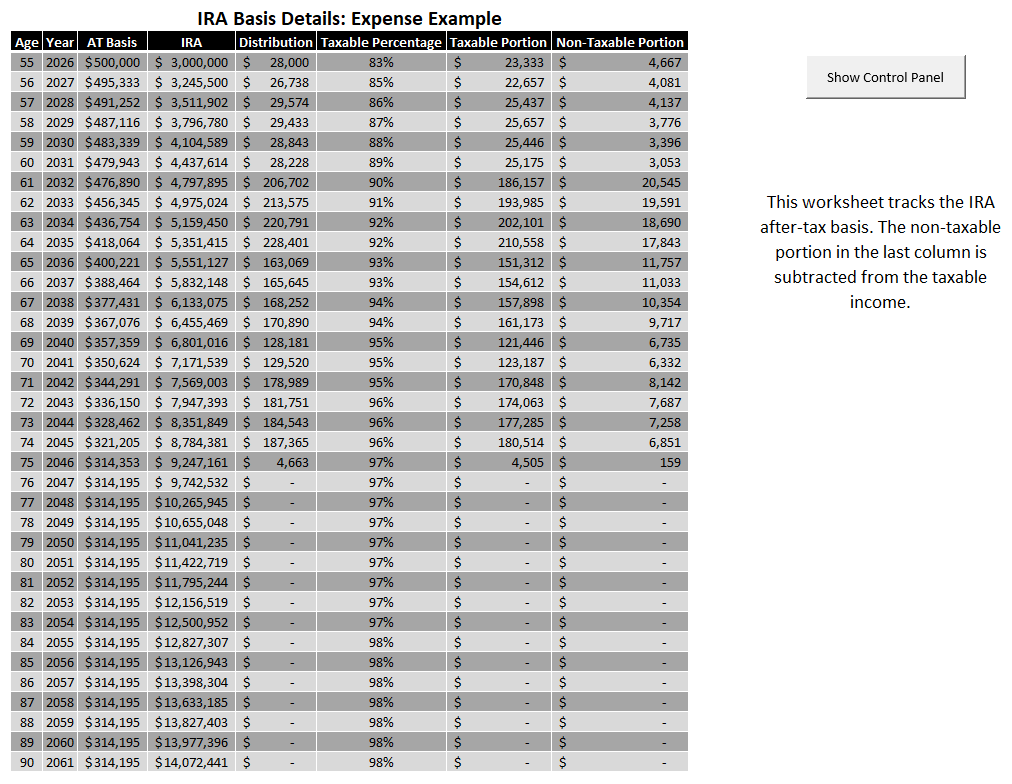
This worksheet is hidden by default and is only supported in the Commercial versions of the Optimizer. The IRA Basis Worksheet tracks non-taxable, after-tax contributions (basis) in your traditional IRA or 401(k) accounts across each projected year. By evaluating the ratio of after-tax basis to total traditional IRA value using the IRS Pro-Rata Rule, this sheet automatically calculates the tax-free and taxable portions of your annual distributions and Roth conversions—ensuring your tax liabilities and after-tax net worth reflect accurate basis recovery over time.
Roth Conversion Optimizer Worksheet
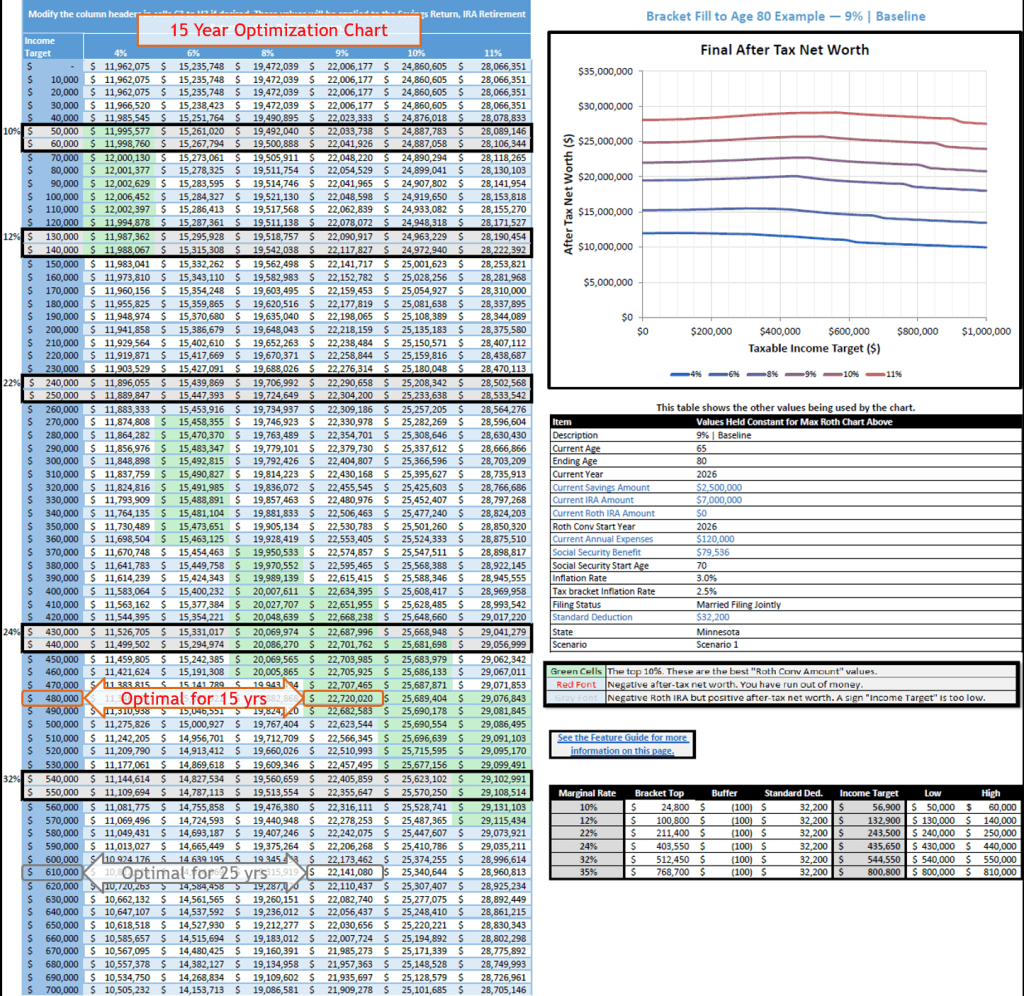
The Roth Conversion Optimizer Worksheet provides a comprehensive visual and data-driven analysis to help identify your ideal conversion strategy, using after-tax net worth as the primary metric to optimize your Roth conversions. Using a deterministic approach, the optimizer tests Income Target values from $0 to $1,000,000 at $10,000 intervals for each rate of return shown in the column headers, clearly highlighting the optimal target incomes at each return rate. The left-hand table also displays where the tops of the tax brackets fall, allowing for a direct side-by-side comparison against standard bracket-filling strategies. To complement this data, the chart located at the top right visually graphs the exact results from the table, giving you an immediate, intuitive view of how different target incomes and rates of return impact your overall wealth (after-tax net worth).

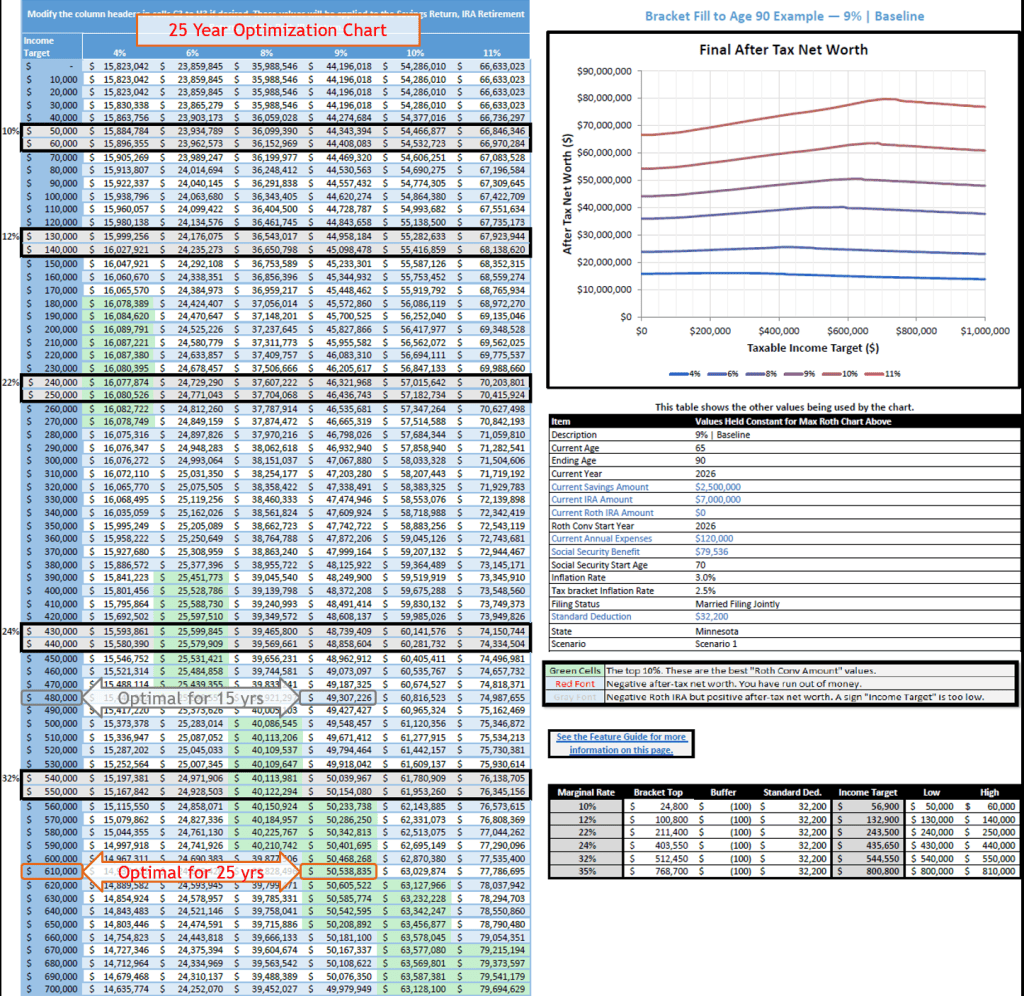
See the Roth IRA Conversion Optimizer Feature Guide for more information.
Monte Carlo Worksheet
The Monte Carlo Worksheet provides a probabilistic assessment of your retirement plan by simulating real-world market uncertainty. Rather than assuming static investment returns, the Monte Carlo engine runs multiple iterations—randomizing each year’s return around your expected rate of return and specified standard deviation. The resulting histogram and summary metrics highlight your overall probability of success, the impact of volatility drag, and the range of potential after-tax net worth outcomes, helping you stress-test your strategy against market fluctuations before finalizing your Roth conversion strategy.

See the Monte Carlo Feature Guide for more information.
Charts Worksheet
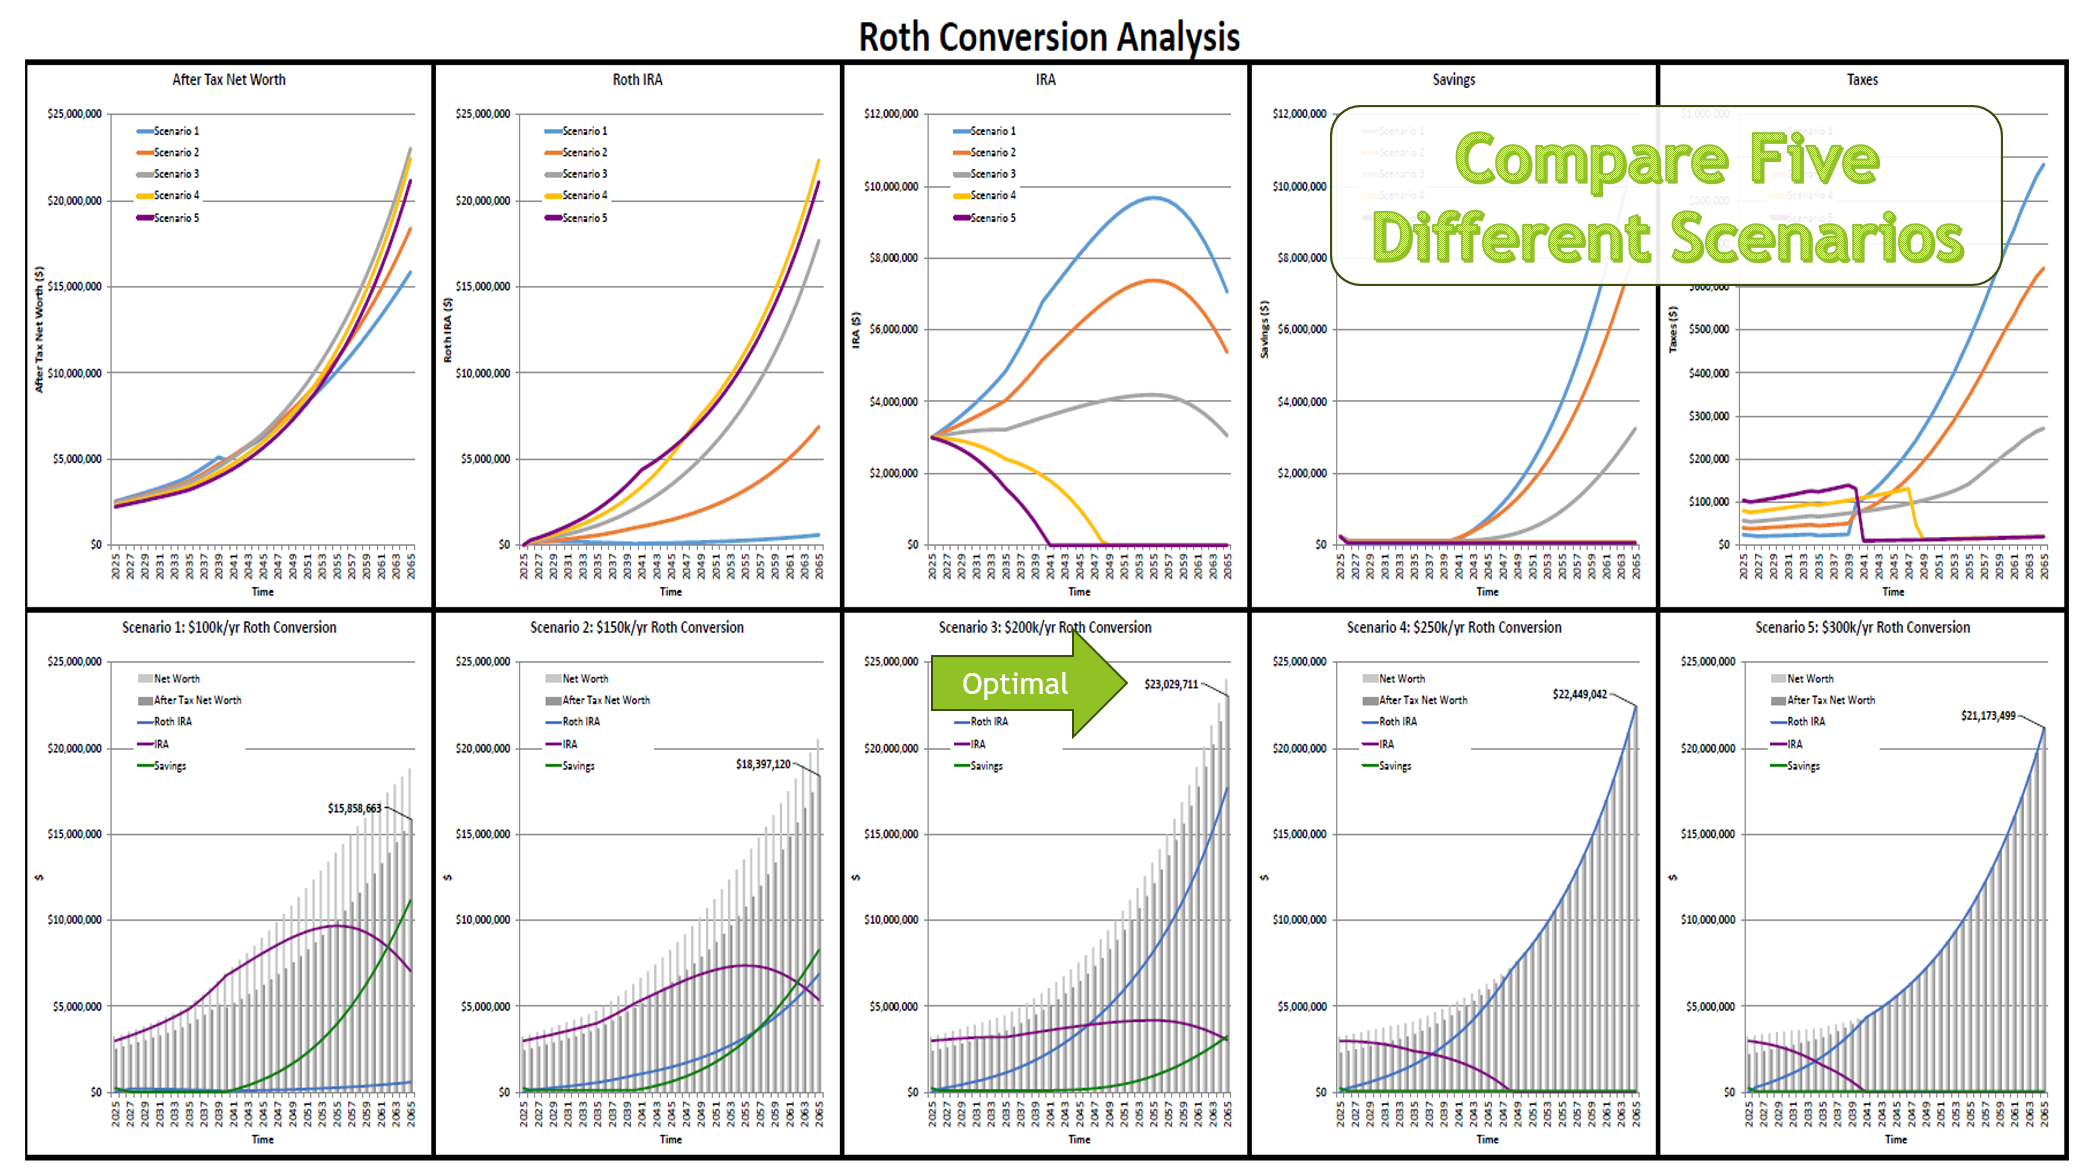
The Charts Worksheet provides a side-by-side visual analysis to compare your top five strategic scenarios across key financial dimensions. By displaying multi-year projections for after-tax net worth, Roth IRA, IRA, Savings (non-retirement), and tax liabilities amounts, these visual graphs allow you to intuitively evaluate trade-offs, identify optimal conversion windows, and select the overall strategy that best meets your long-term retirement goals.
Tax Bracket Worksheet
This worksheet is hidden by default. The Tax Bracket Worksheet displays the underlying federal and state tax bracket tables used to calculate tax liabilities throughout the model. The brackets shown here are dependent on the user-specified settings in the Scenario.
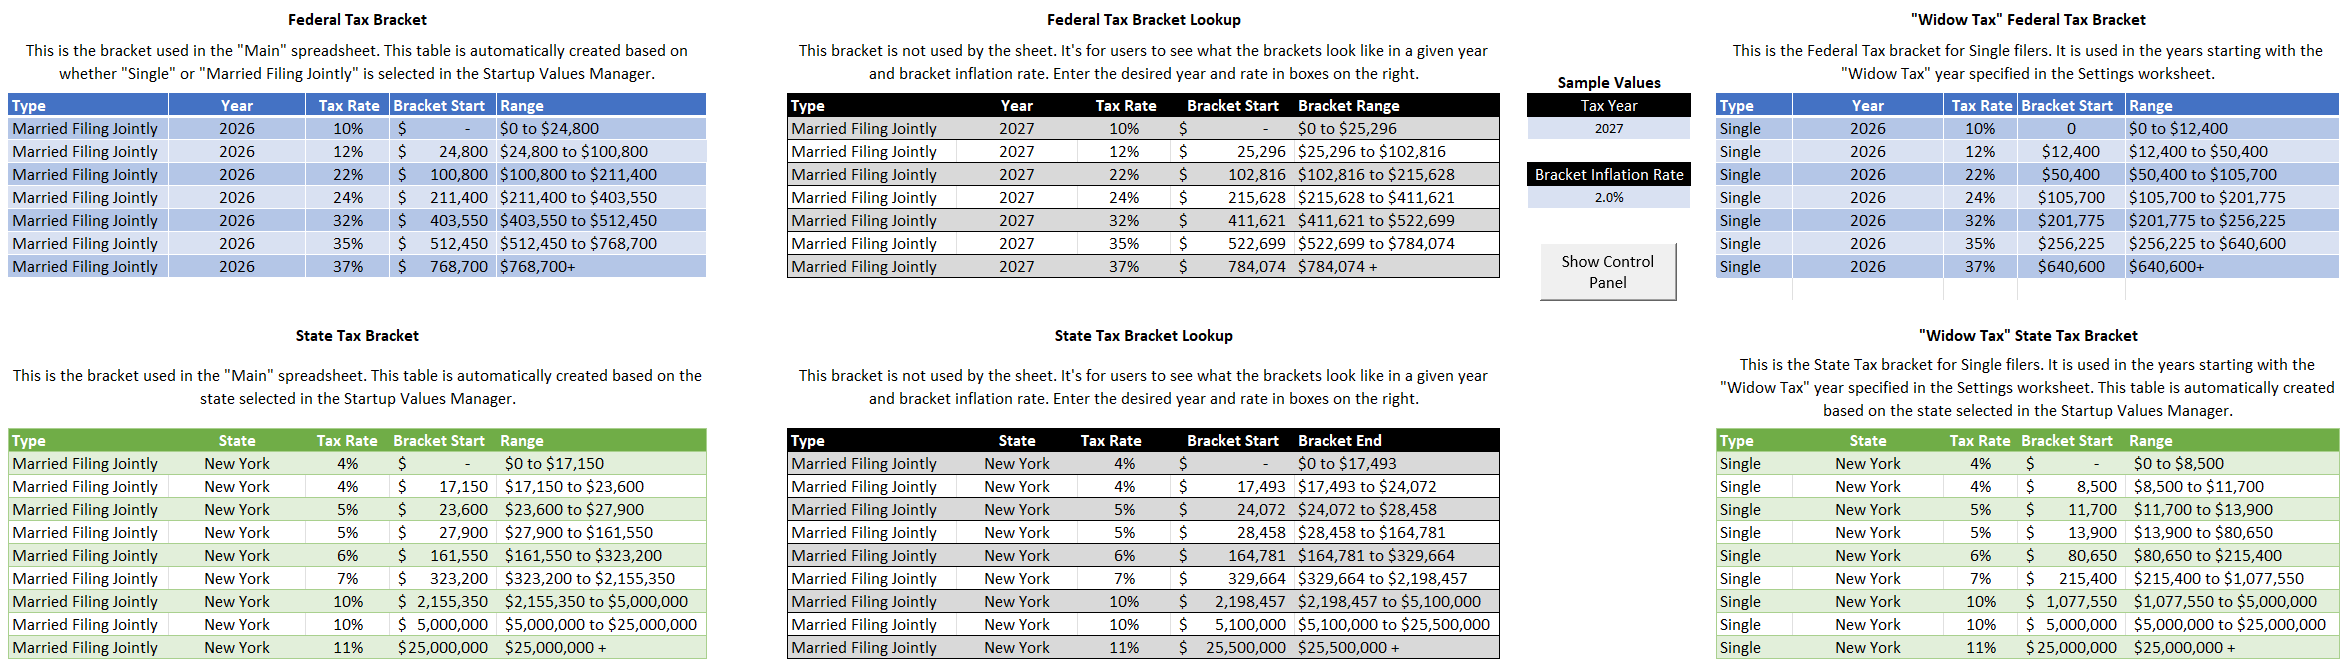
In addition to showing the brackets for the current year, this sheet features interactive lookup tables that allow you to preview future tax brackets. By entering a specific tax year and projected bracket inflation rate, you can instantly see how federal and state ordinary income thresholds adjust over time.
On the right, the worksheet displays the tax brackets for the Single filing status. This provides a quick reference for Married Filing Jointly users who want to project their future tax exposure under the “Widow Tax” scenario if a spouse passes away.
IRMAA Worksheet
This worksheet is hidden by default. The IRMAA Worksheet provides a complete breakdown of Medicare Part B and Part D Income-Related Monthly Adjustment Amounts across each projected year. By evaluating your Modified Adjusted Gross Income (MAGI) against official Medicare surtax brackets, this sheet shows you your estimated monthly and annual premium surcharges—helping you anticipate tier shifts, evaluate the impact of Roth conversions on Medicare costs, and model potential IRMAA bracket creep over time.
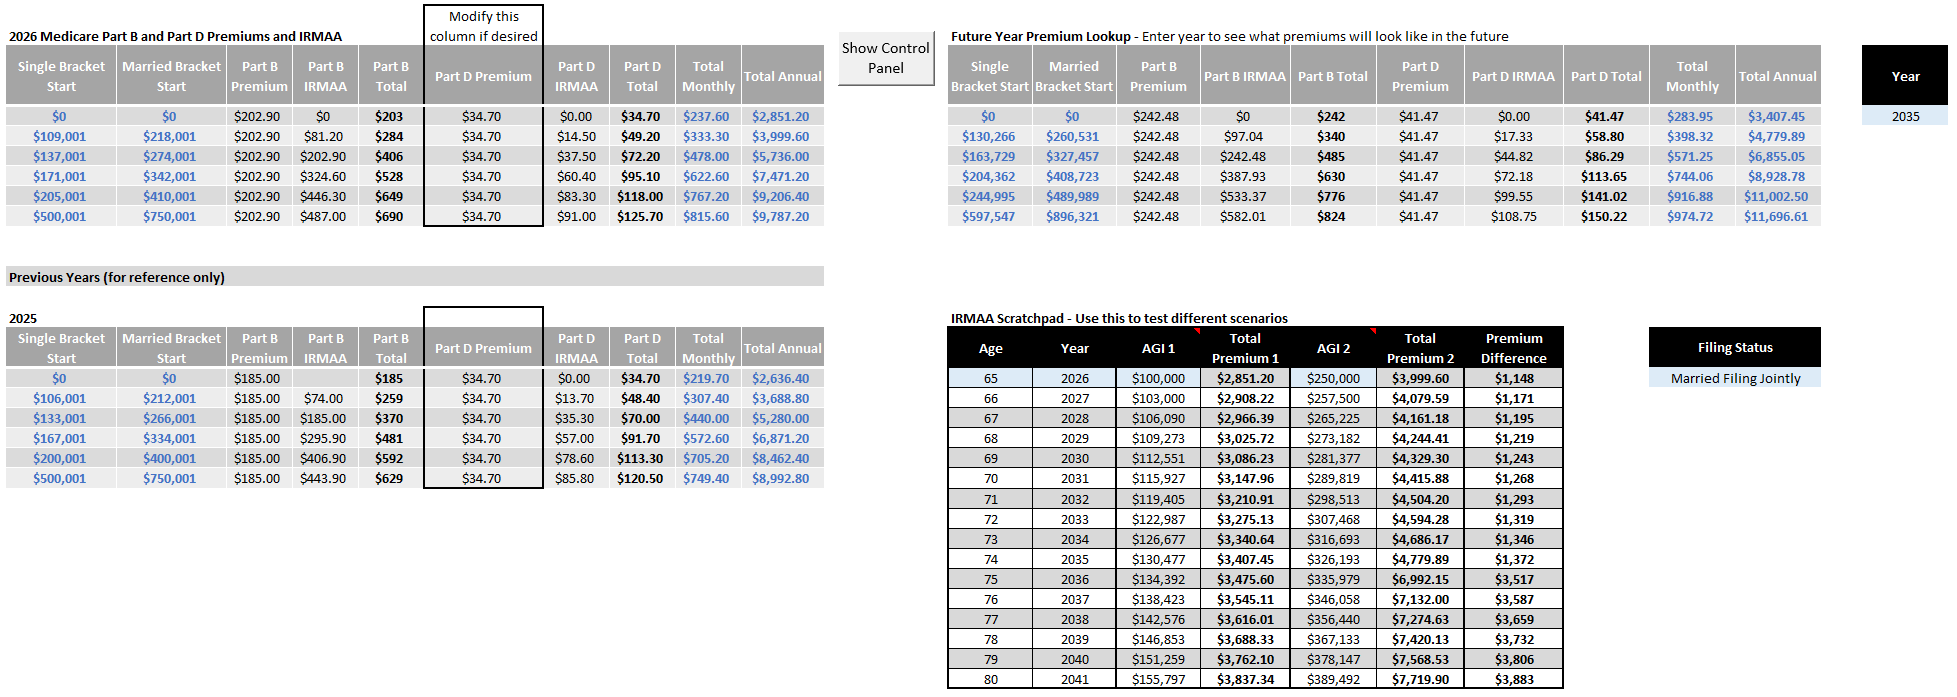
To the right of the primary table, the worksheet features two interactive planning tools. The top-right Medicare Lookup table projects future Part B and Part D premiums for any selected year based on your assumed inflation rate. Below it, the Comparison Scratchpad lets you evaluate two different MAGI levels side-by-side, making it easy to instantly see how moving between income tiers impacts your total annual Medicare surcharges.