
A high‑net‑worth client recently asked their advisor a straightforward question:
“I have a $3 million IRA and plenty of non‑retirement assets to pay the tax. Should I convert all of it this year, or spread it out?”
Explaining multi-year tax dynamics verbally or using basic static charts is notoriously difficult. Without a dedicated multi-year engine to visually map out the numbers, even seasoned advisors struggle to give clients immediate clarity in these moments.

This is exactly the kind of moment where the Roth IRA Conversion Optimizer should be open, live, in front of the client.
The Optimizer Shows the Truth in Seconds: The Patterns All Tie
When we ran this scenario through the Optimizer, the result was unmistakable:
- $500k per year until the IRA is fully drained
- $1M per year for three years
- $1.5M per year for two years
- $3M in a single year
All four Roth conversion paths produced essentially the same after‑tax net worth.
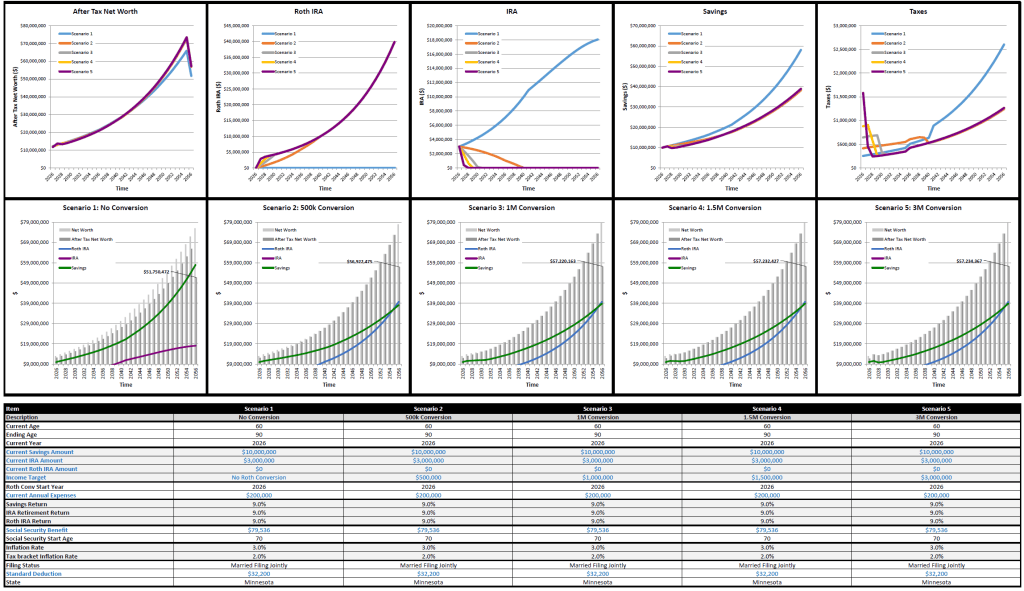
Why? Because once the IRA is fully drained early, the long‑term outcome is dominated by Roth growth and taxable savings growth — not by whether the IRA was emptied in one, two, three, or even seven-plus steps.
The Optimizer already incorporates:
- Marginal federal brackets
- IRMAA and NIIT effects
- Estate‑tax impacts
- Widow‑penalty dynamics
So when these conversion patterns tie, it’s not because something was overlooked — it’s because the math is complete.
Where the Curve Actually Bends
While $500k/year looks equivalent in this particular chart, the true knee of the curve is just below $500k/year.
Once conversions drop below that threshold:
- RMD-driven bracket creep begins to erode wealth
- NIIT and IRMAA impacts repeat over more years
- Tax drag compounds on non‑retirement assets
That’s where the Optimizer shows a meaningful reduction in after‑tax net worth.
But above that knee — $500k, $1M, $1.5M, $3M — the outcomes are essentially identical.
Why These Four Data Points Tie: The Headwinds and Tailwinds
Spreading conversions out is traditionally assumed to be better because of marginal tax brackets. That’s the core intuition behind conventional multi-year planning—and it’s usually where most tax analysis stops.
But the Optimizer reveals the full picture. Several headwinds and tailwinds interact, and they largely cancel each other out above the $500k knee.
Tailwind for Spreading Conversions: Marginal Brackets
This is the classic intuition:
- Smaller conversions keep you in lower brackets.
- Larger conversions push you into higher brackets.
This is true — but it’s only one force in the system.
Headwinds for Spreading Conversions (Often Overlooked)
A single $3M conversion year concentrates NIIT to that tax year and limits IRMAA surcharges to just one future year. Spreading conversions over 5–10 years means paying higher IRMAA and NIIT surcharges year after year.
Tax drag on non‑retirement assets gets worse the longer you wait. Paying taxes from brokerage assets sooner moves money into the Roth sooner. Roth dollars grow tax‑free. Brokerage dollars grow with tax drag. The longer you delay conversions, the longer you expose growth to taxation.
Converting sooner creates more years of 0% long‑term capital gains harvesting. Once the IRA is fully drained, the client has multiple years of low ordinary income before Social Security begins. In 2026, the 0% LTCG bracket was roughly $100,000 for MFJ — meaning the client can harvest up to that amount tax‑free each year. Dragging conversions out forces more taxable portfolio growth into future years where it will be taxed.
The Net Effect
Above the $500k knee, these forces offset each other:
- Marginal brackets favor spreading conversions.
- IRMAA/NIIT, tax‑drag dynamics, and free LTCG harvesting favor converting sooner.
The Optimizer shows that once you’re converting at $500k/year or more, these headwinds and tailwinds balance out — producing nearly identical lifetime outcomes.
How the Optimizer Transforms the Conversation
The advisor didn’t need a perfect verbal explanation of marginal brackets. They needed the Optimizer.
With the tool open, they could have:
- Entered the client’s actual data in real time.
- Displayed side‑by‑side charts for the four conversion patterns.
- Shown the client visually that the outcomes are nearly identical.
- Explained that IRMAA, NIIT, estate tax, and widow penalty are already baked into the math.
At that point, the conversation naturally shifts:
“Since the math says these options are effectively tied, let’s talk about which one feels better for you.”
This is the moment where advisors build trust — by showing, not guessing.
Only After the Optimizer Shows the Tie Do Secondary Factors Matter
Because the Optimizer has already handled the complex tax interactions, the remaining considerations are minor and client‑experience‑focused:
- Client psychology — Some prefer one decisive year; others prefer a smoother multi‑year path.
- Tax‑payment logistics — One large payment vs. several smaller ones.
- Liquidity preference — Even if they can pay the tax, they may not want to liquidate that much at once.
- Documentation/audit comfort — Some clients prefer a pattern that “looks normal” on a tax return.
- Charitable timing — Coordinating conversions with large gifts or DAF contributions.
- Life‑event timing — Aligning conversions with business sales, gifting plans, or income changes.
These factors don’t materially change the lifetime math — but they matter to the client’s lived experience.
Why This Post Matters for Advisors
This positioning is powerful for the advisor community because:
- It shows how easily an advisor can lose credibility without a multi‑year tax engine.
- It demonstrates the Optimizer’s ability to reveal counterintuitive truths — like the equivalence of $500k, $1M, $1.5M, and $3M conversions (for this scenario).
- It teaches advisors a repeatable behavior: open the Optimizer, show the charts, then pivot to client‑centric factors.
- It reinforces that the Optimizer already handles IRMAA, NIIT, estate tax, and widow penalty — so advisors don’t need to guess.
The real message is simple:
When the stakes are this high, you should be showing the client their actual data.
That’s the difference between guessing and showing—and exactly what the Optimizer is built to deliver.